User Interface
ZetaForge comes with an easy-to-use User Interface (UI) that allows the developers to fully focus on the complexities of their machine learning pipelines. Let's take a quick look at ZetaForge and its various UI functionalities.
Basics
The main window of the application appears as follows:
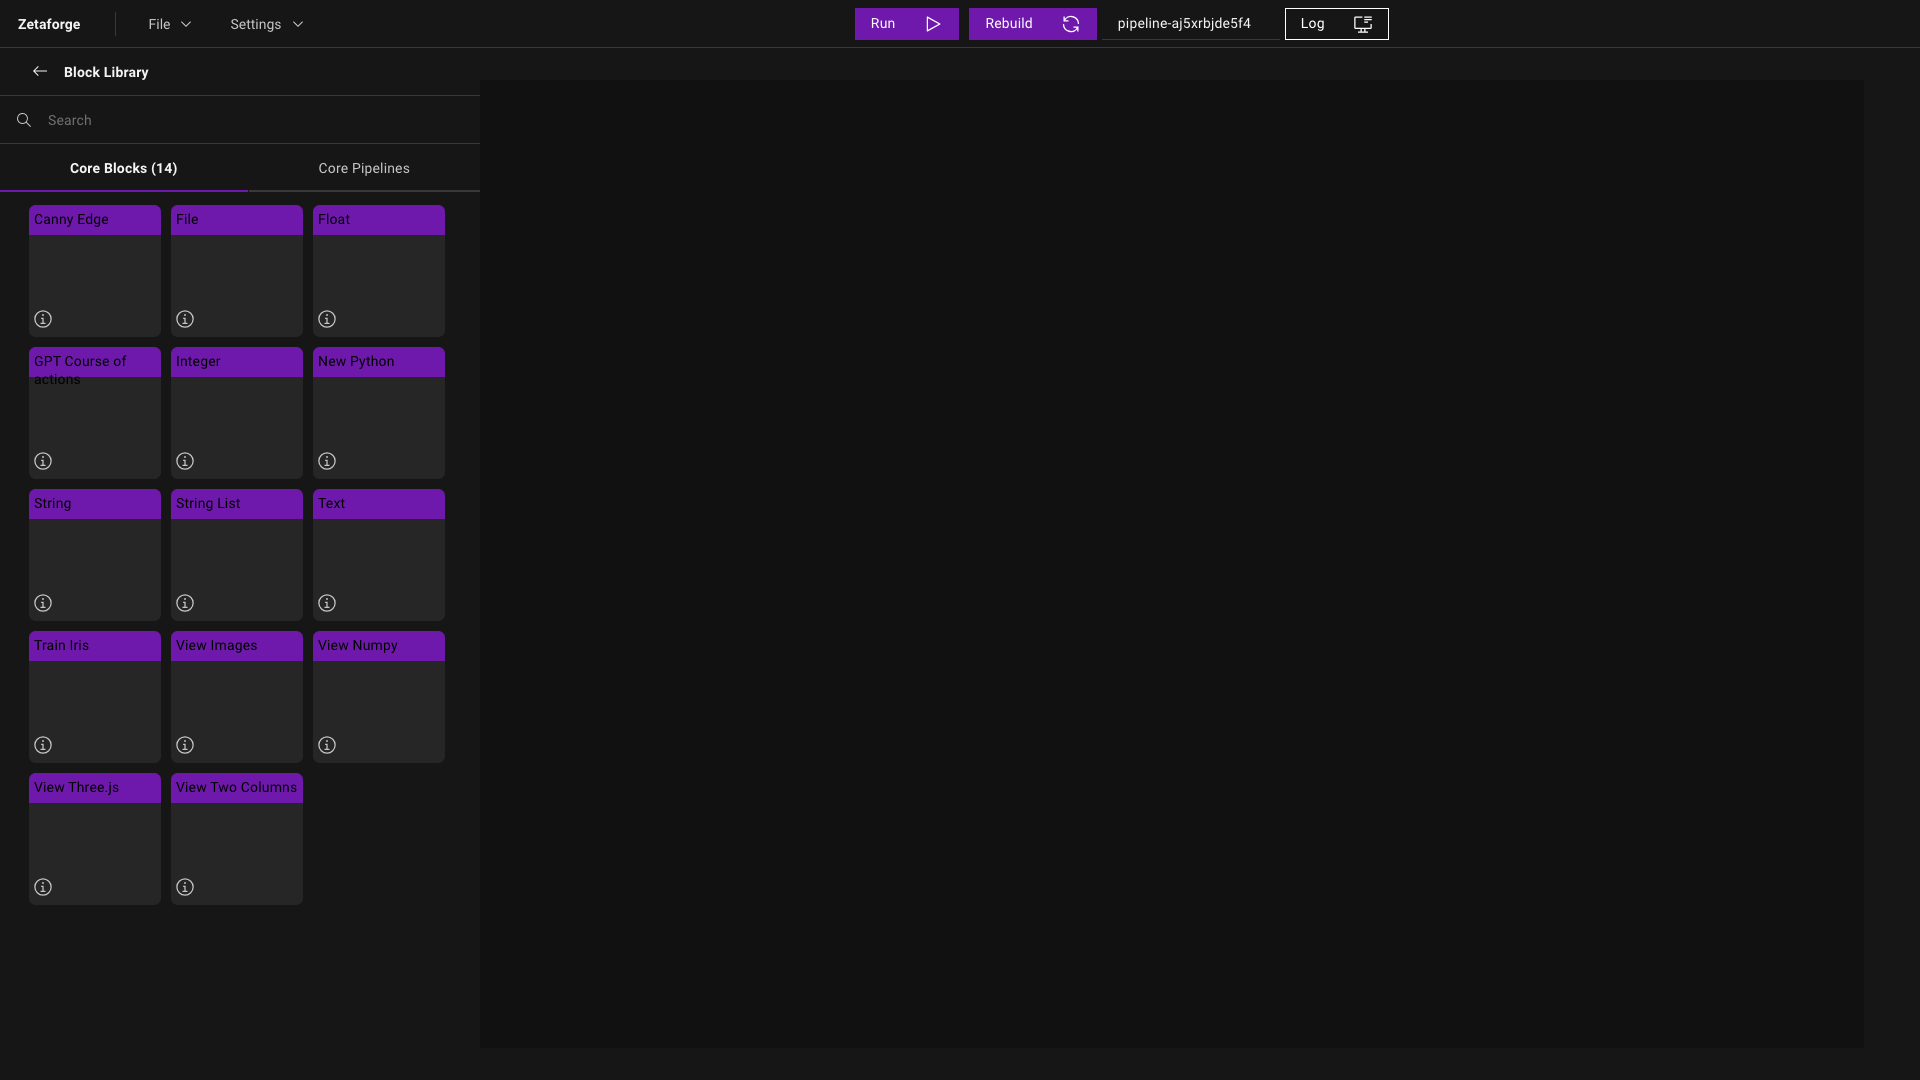
On the left-hand side, you can find the Block Library that contains the predefined Core Blocks and Core Pipelines. By hovering over the info icon, you can read the description of each Block or Pipeline. You can use the search bar to filter Blocks and Pipelines by name. Also, if you need more space, you can close the Block Library using the left arrow icon.
Add or Remove Blocks/Pipelines
The black canvas is your workspace. You can add Blocks or Pipelines to your workspace by a simple drag-and-drop action.
To remove a Block, right-click on the Block and click on the ![]() that appears on the top-right of the Block.
that appears on the top-right of the Block.
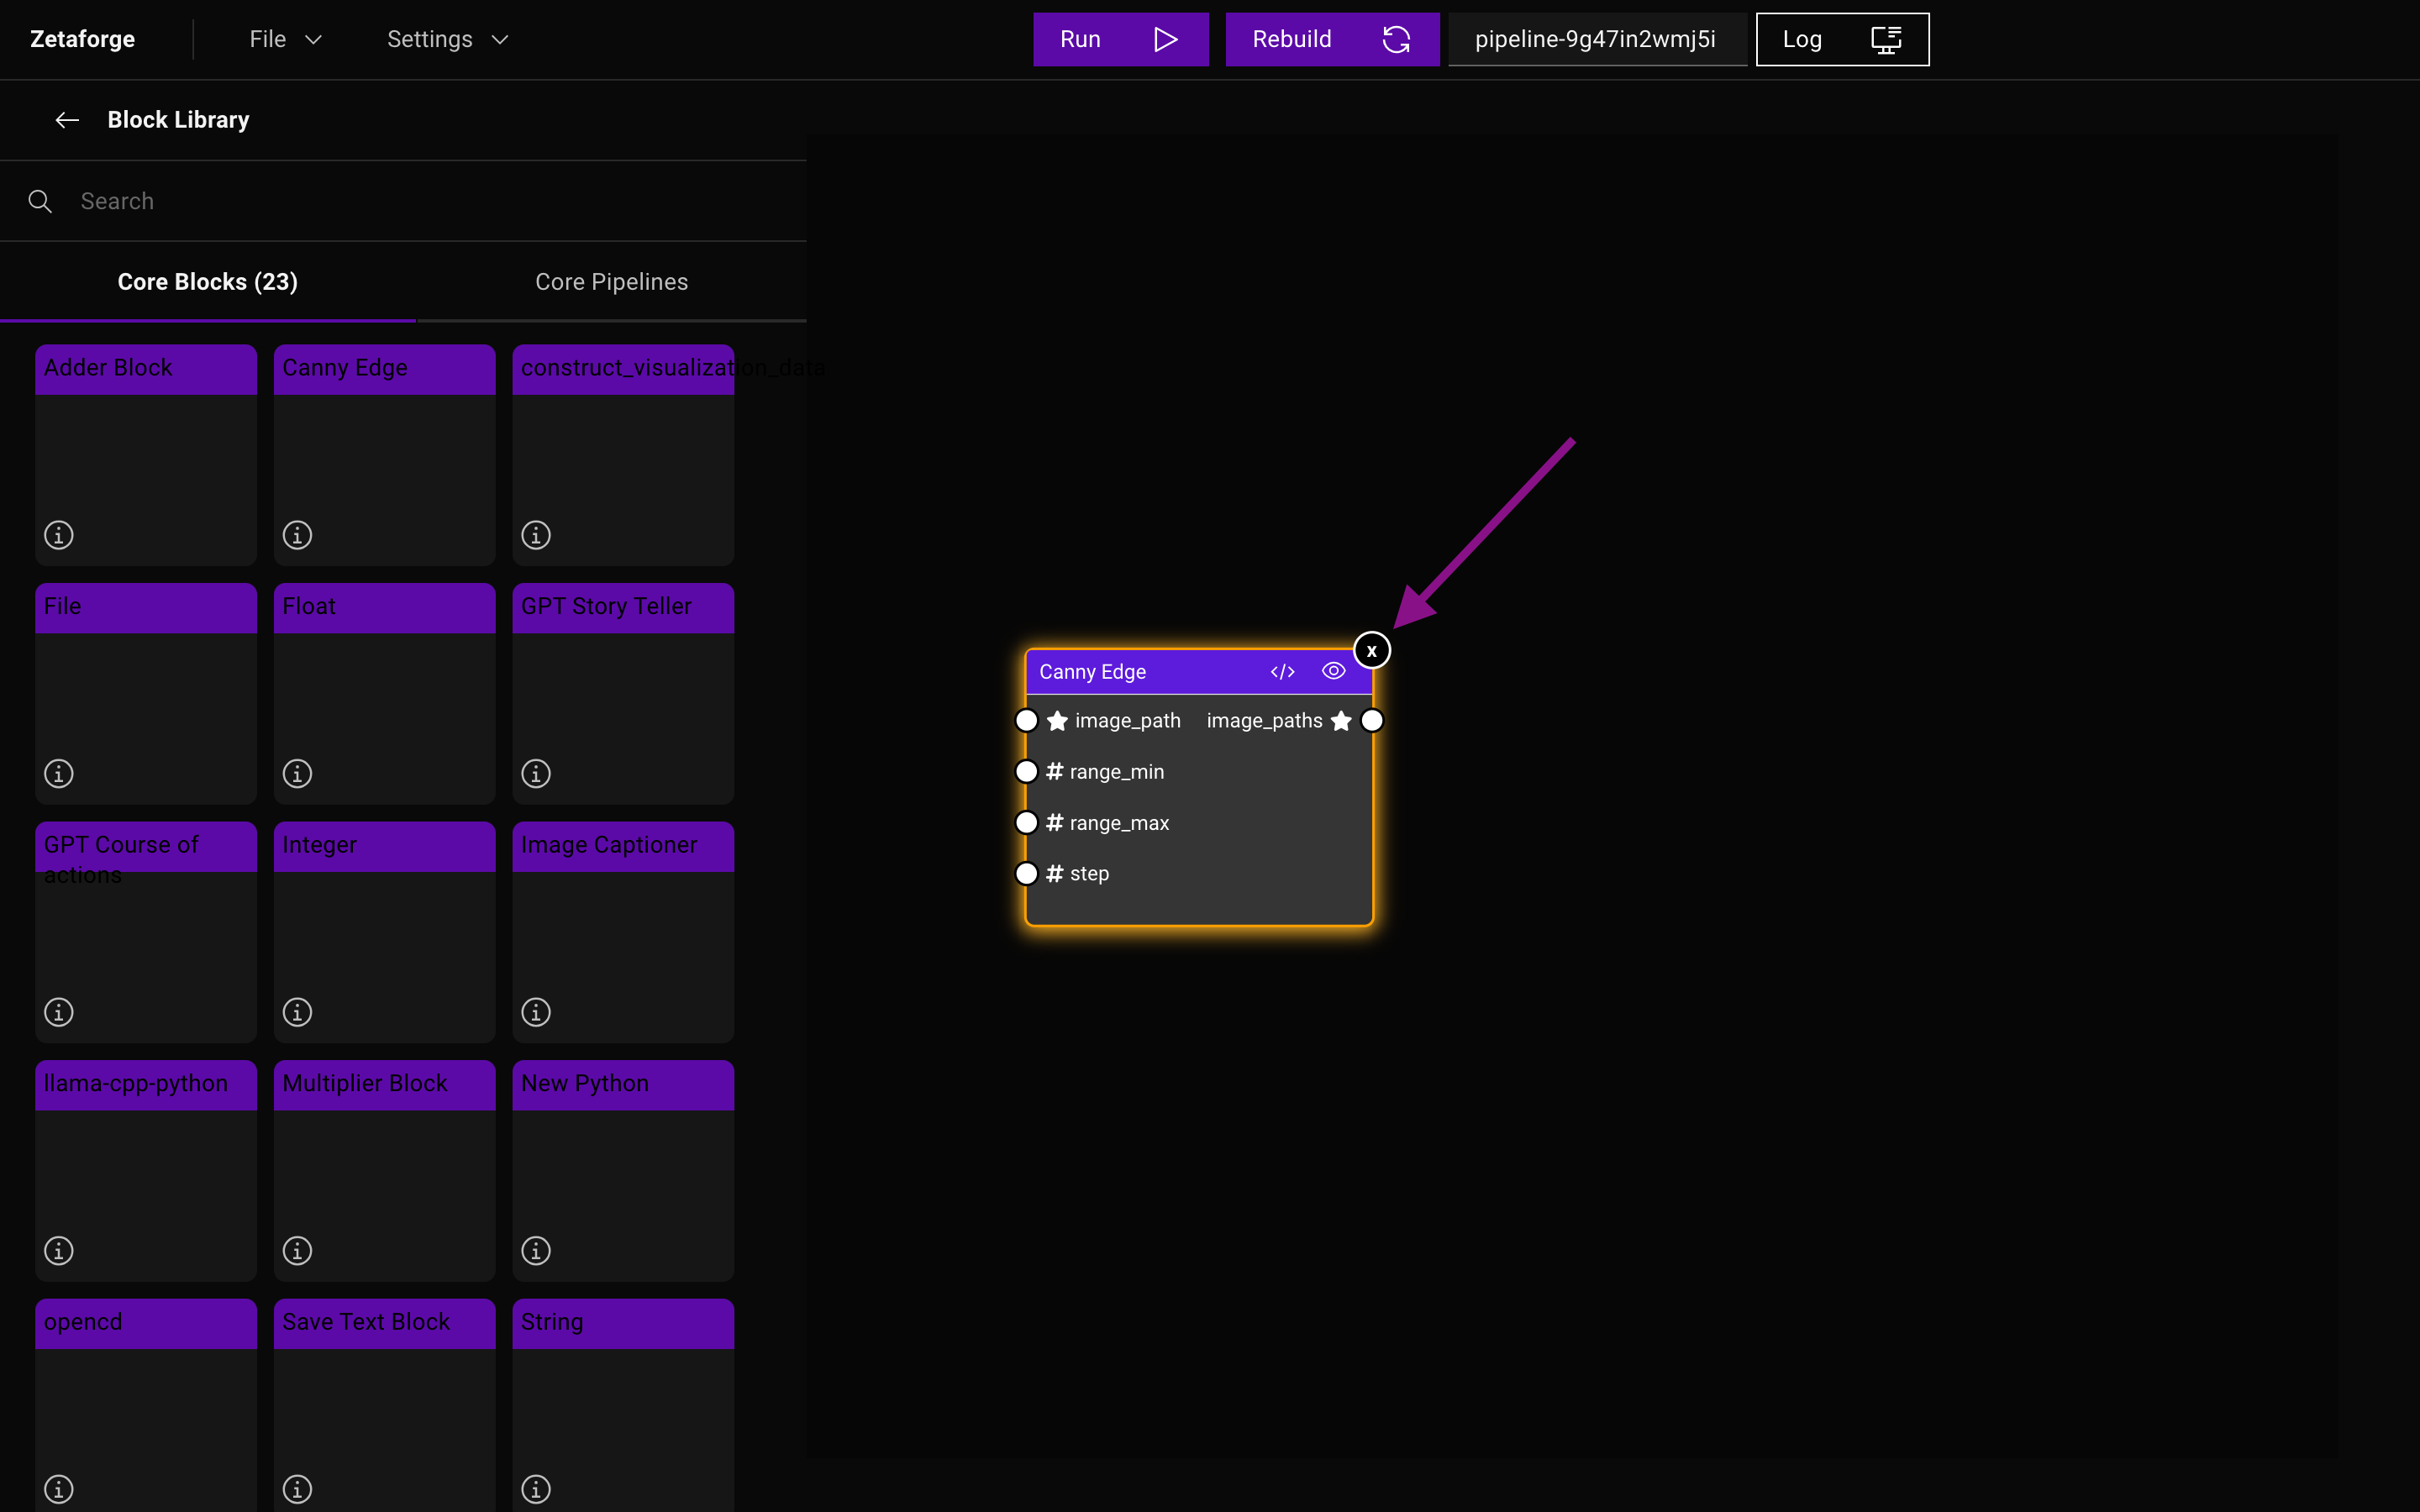
To remove a Pipeline, you can create a new workspace by clicking File -> New.
Make or Remove Links
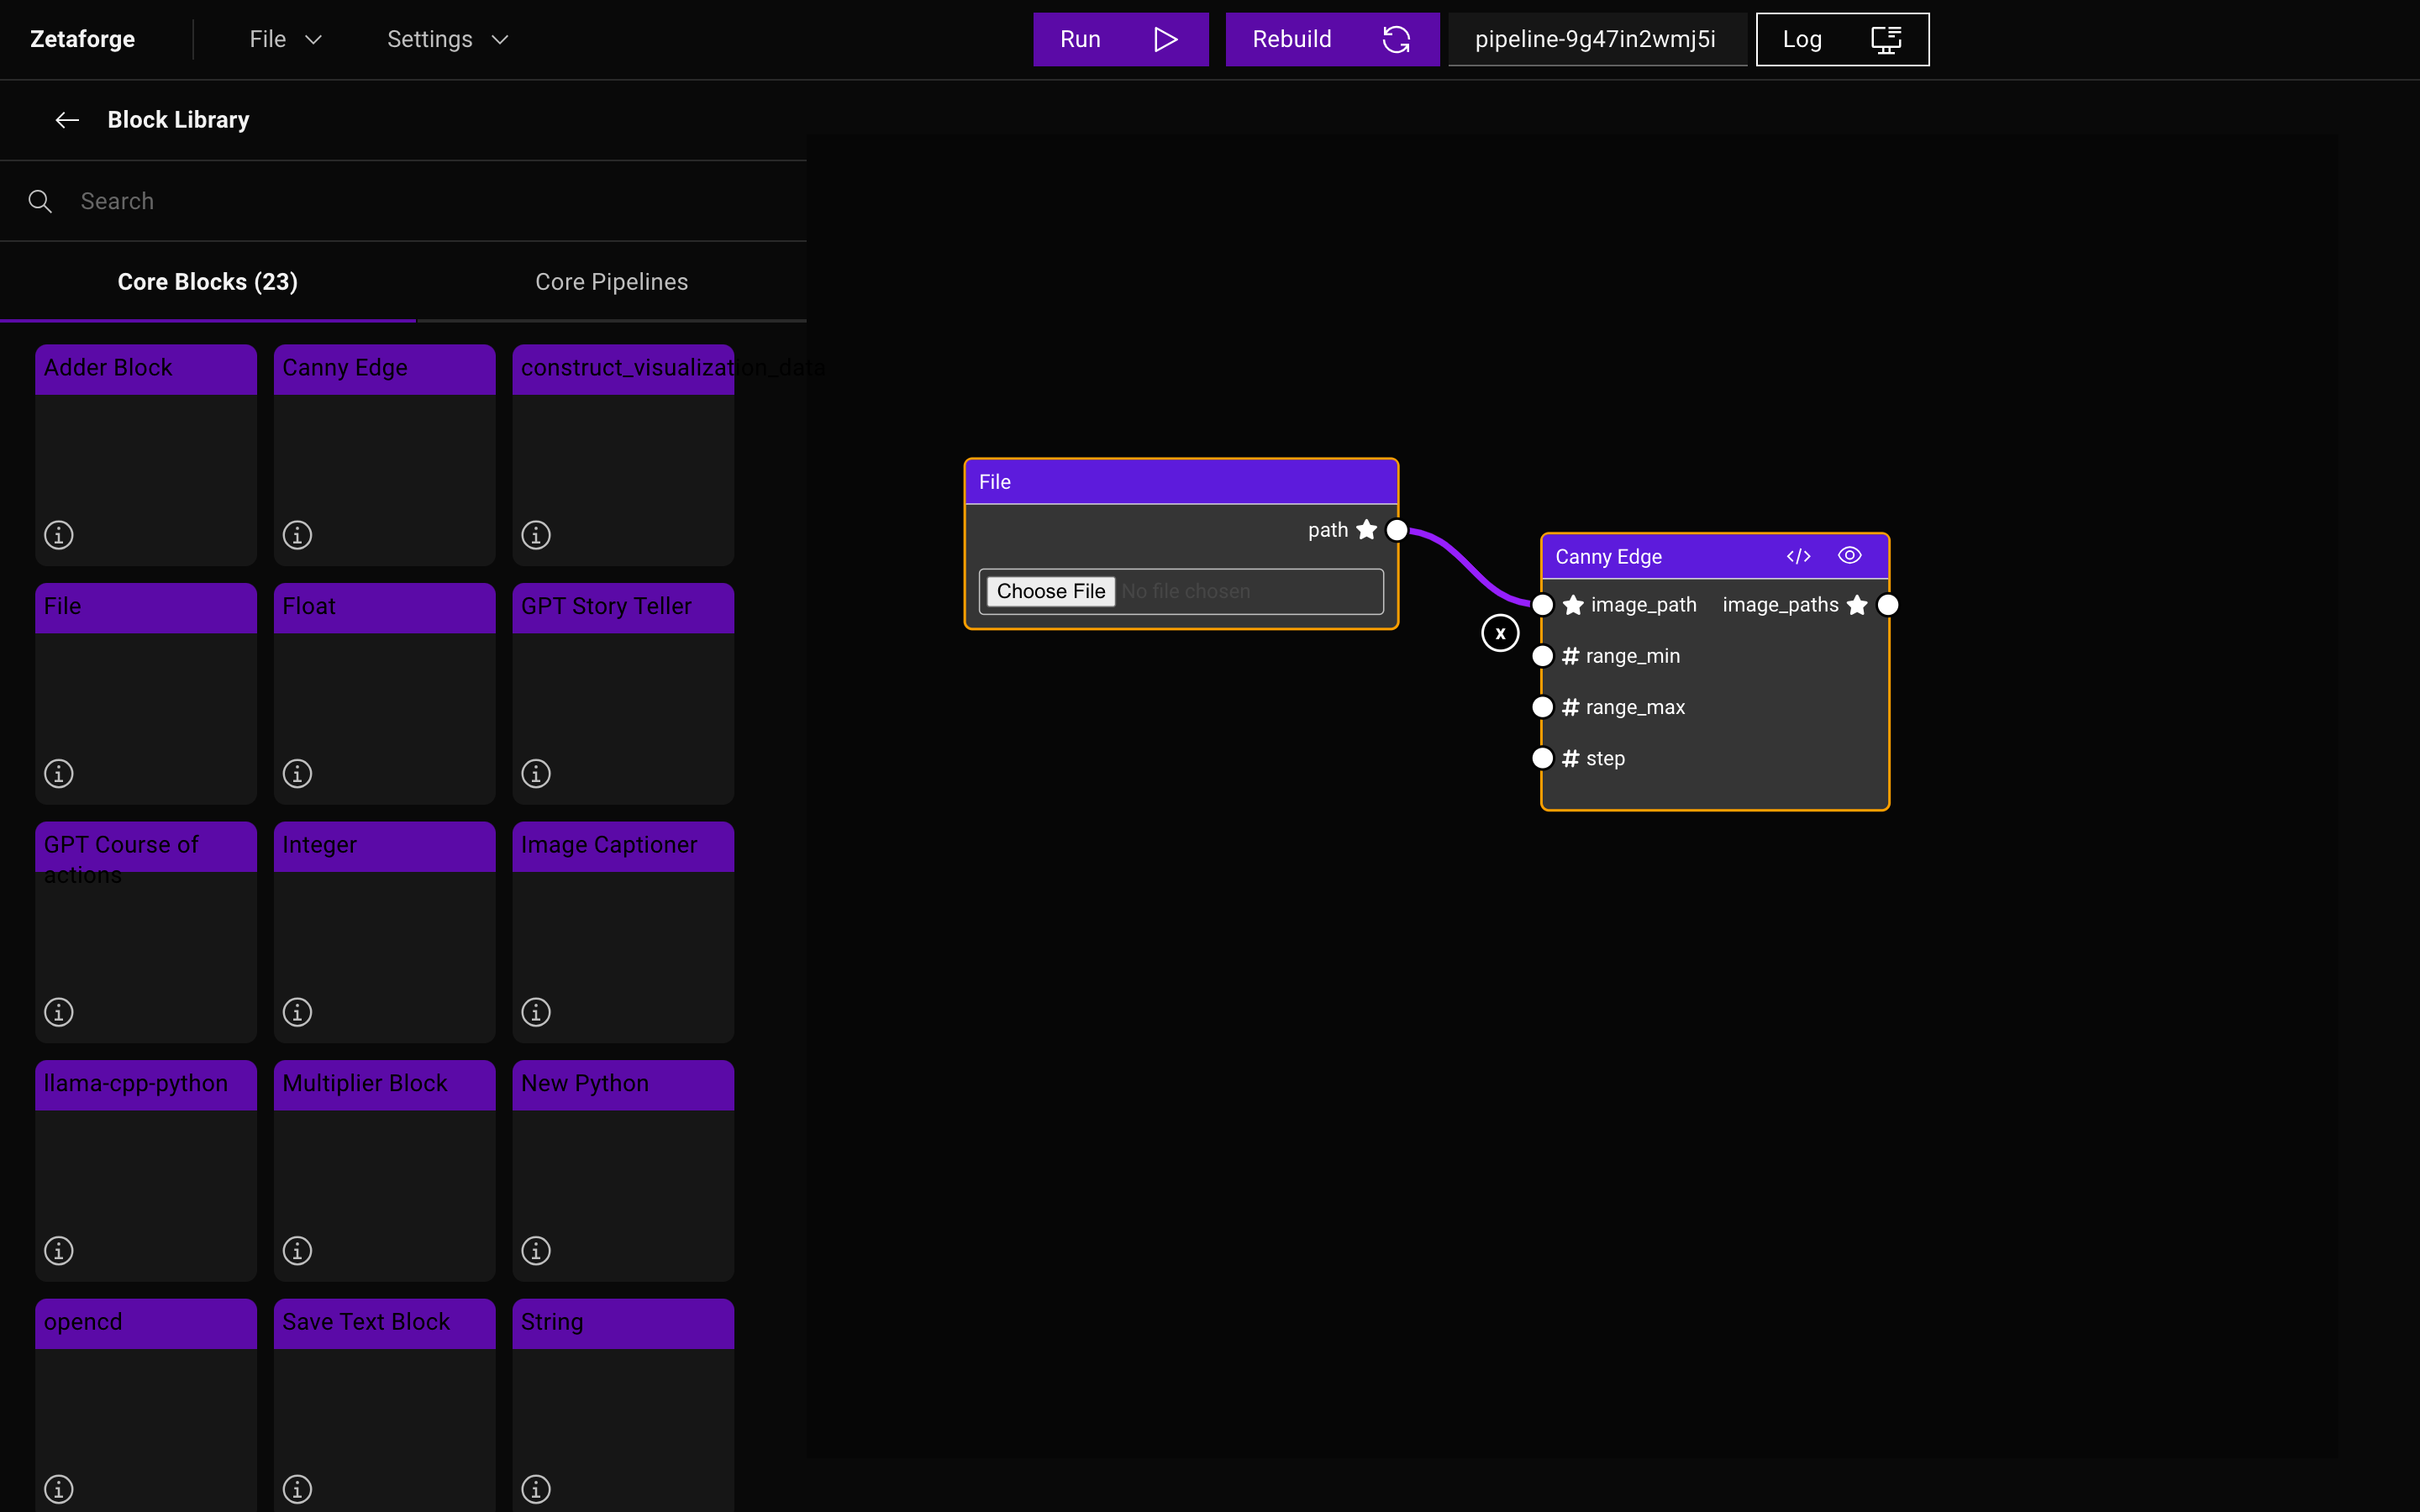
Each Block can have input and output nodes, which are connected to the other Blocks using links. The links between the Blocks can be made by clicking on the source node and dragging the connection to the destination node.
If you change your mind and want to remove a link, right-click on the link and then click on the ![]() icon that
appears on top of the link to remove that link.
icon that
appears on top of the link to remove that link.
Save or Load Blocks/Pipelines
Saving and loading ZetaForge Blocks and Pipelines comes handy especially when you want to share your creations with
other developers and team members. To save the current Blocks or Pipelines in your workspace, click on File -> Save As
and follow the instructions.
If you have a Block or Pipeline saved on your machine and want to load that in your workspace,
click on File -> Load
and select Block or Pipeline depending on what you need to load. This would place the loaded Block or Pipeline
into your workspace.
Block Editor
The Block Editor comes with some interesting features that provide access to Block-level information and make your
coding experience much smoother. It allows you
to view the components of a Block or modify them through the UI without having to leave the
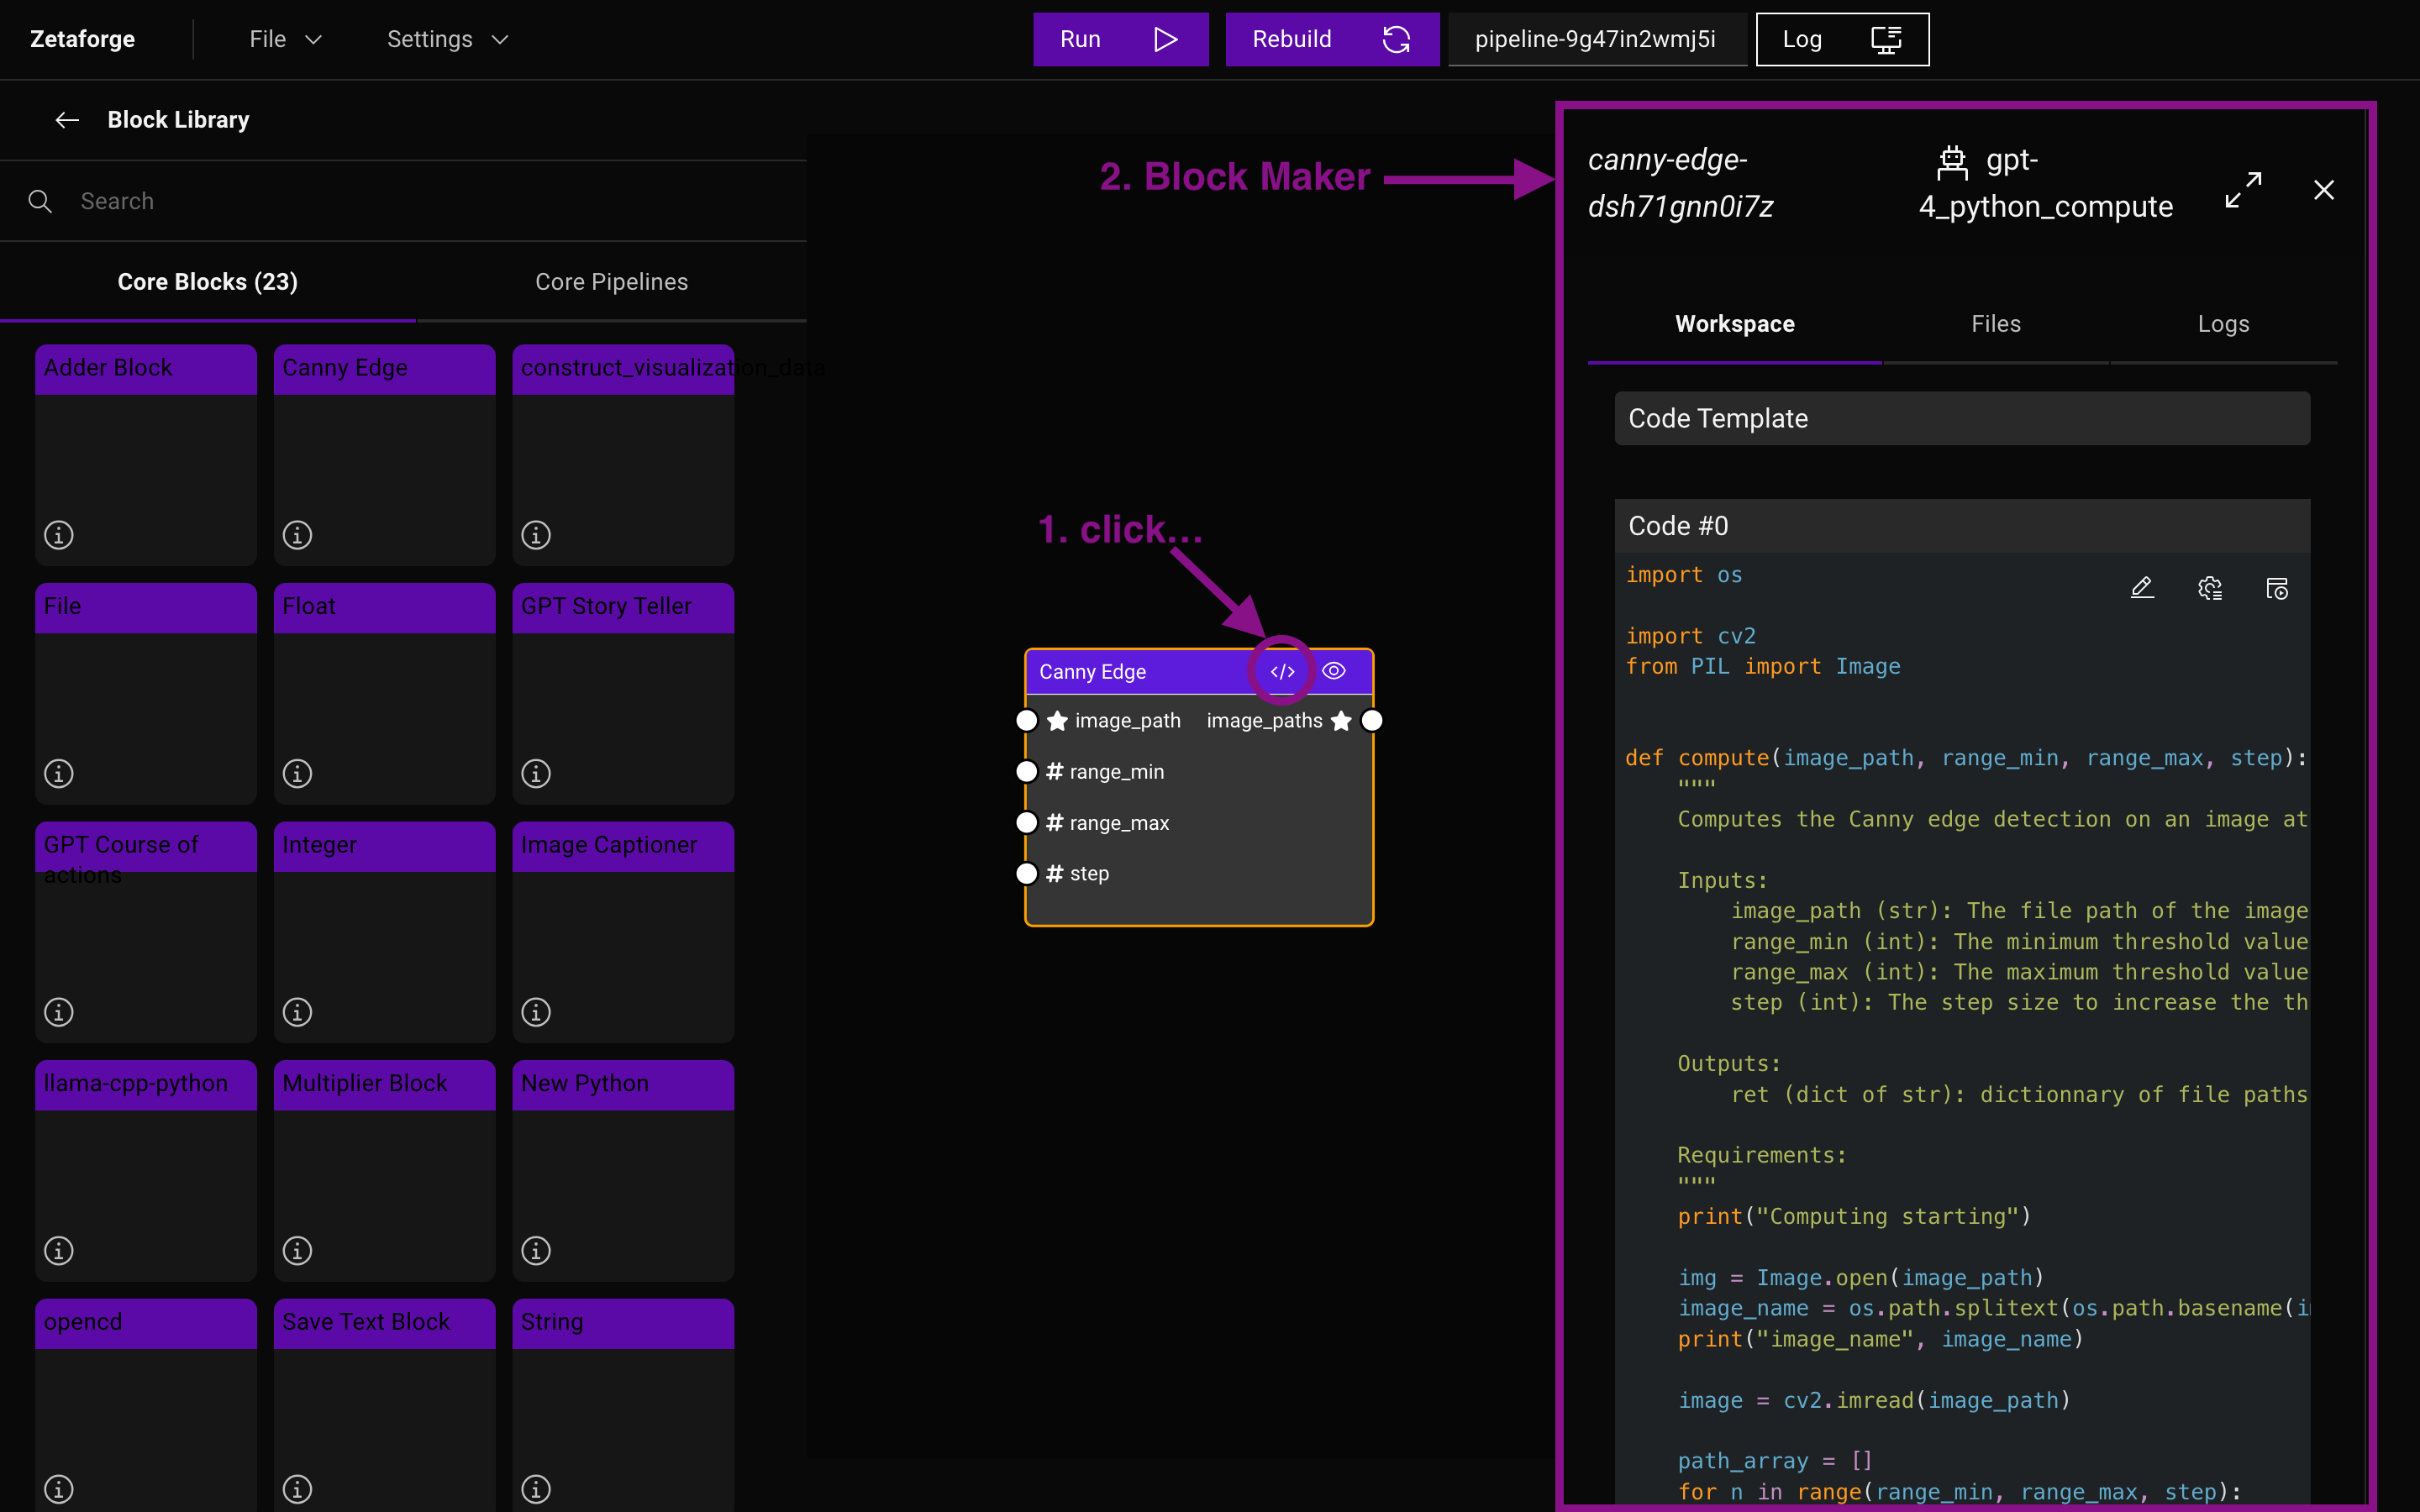
platform and switch to a code editor. To open the Block Editor sidebar, click on the </ > icon on a Block header.
We will go over some of the Block Editor features next.
View Block Components
To view the files associated with a Block, first, open the Block Editor. Inside the Block Editor, you can see the
Block id on top. You can make this window full-screen by clicking the
 button or close it using the
![]() button.
button.
Workspace
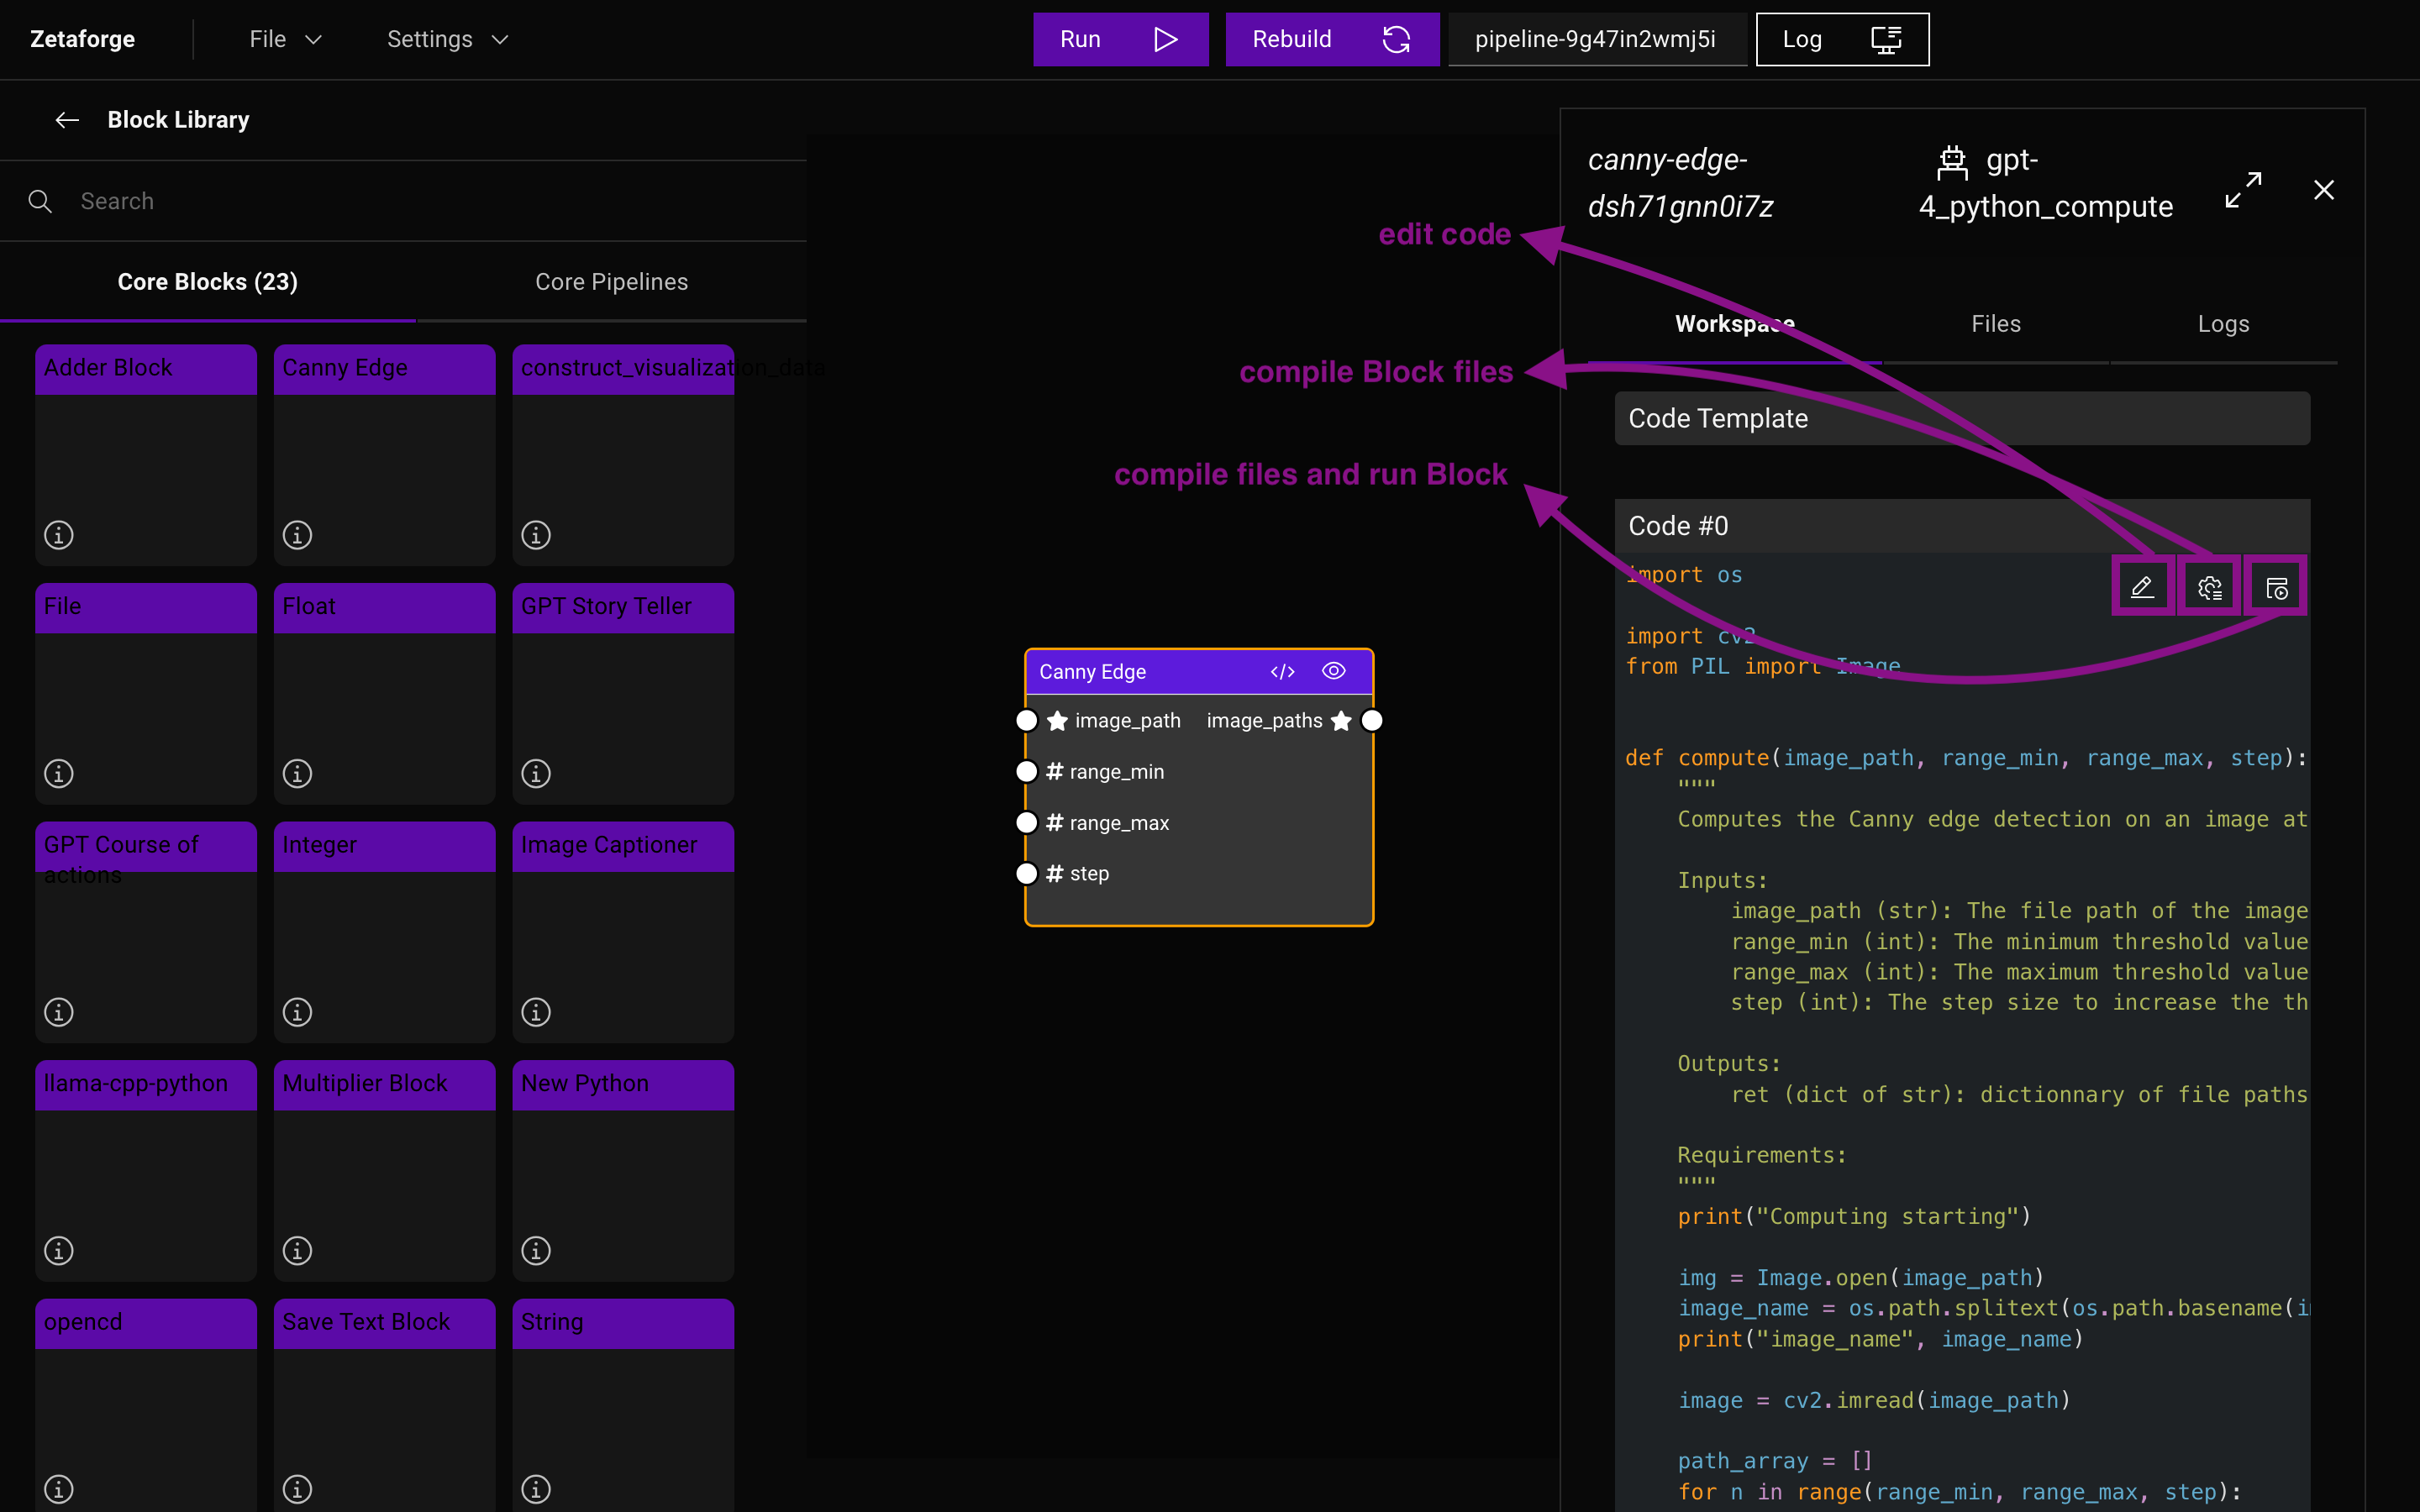
Under the Workspace tab in the Block Editor, you can see the contents of the computations.py file for the selected
Block. To modify the code, click on the Edit code icon and start editing. Save the new version of your code by clicking
on the Save button and compile the code by clicking on the Compile block files icon.
You can compile and run the Block at the
same time by clicking the Compile files and run block icon.
Files
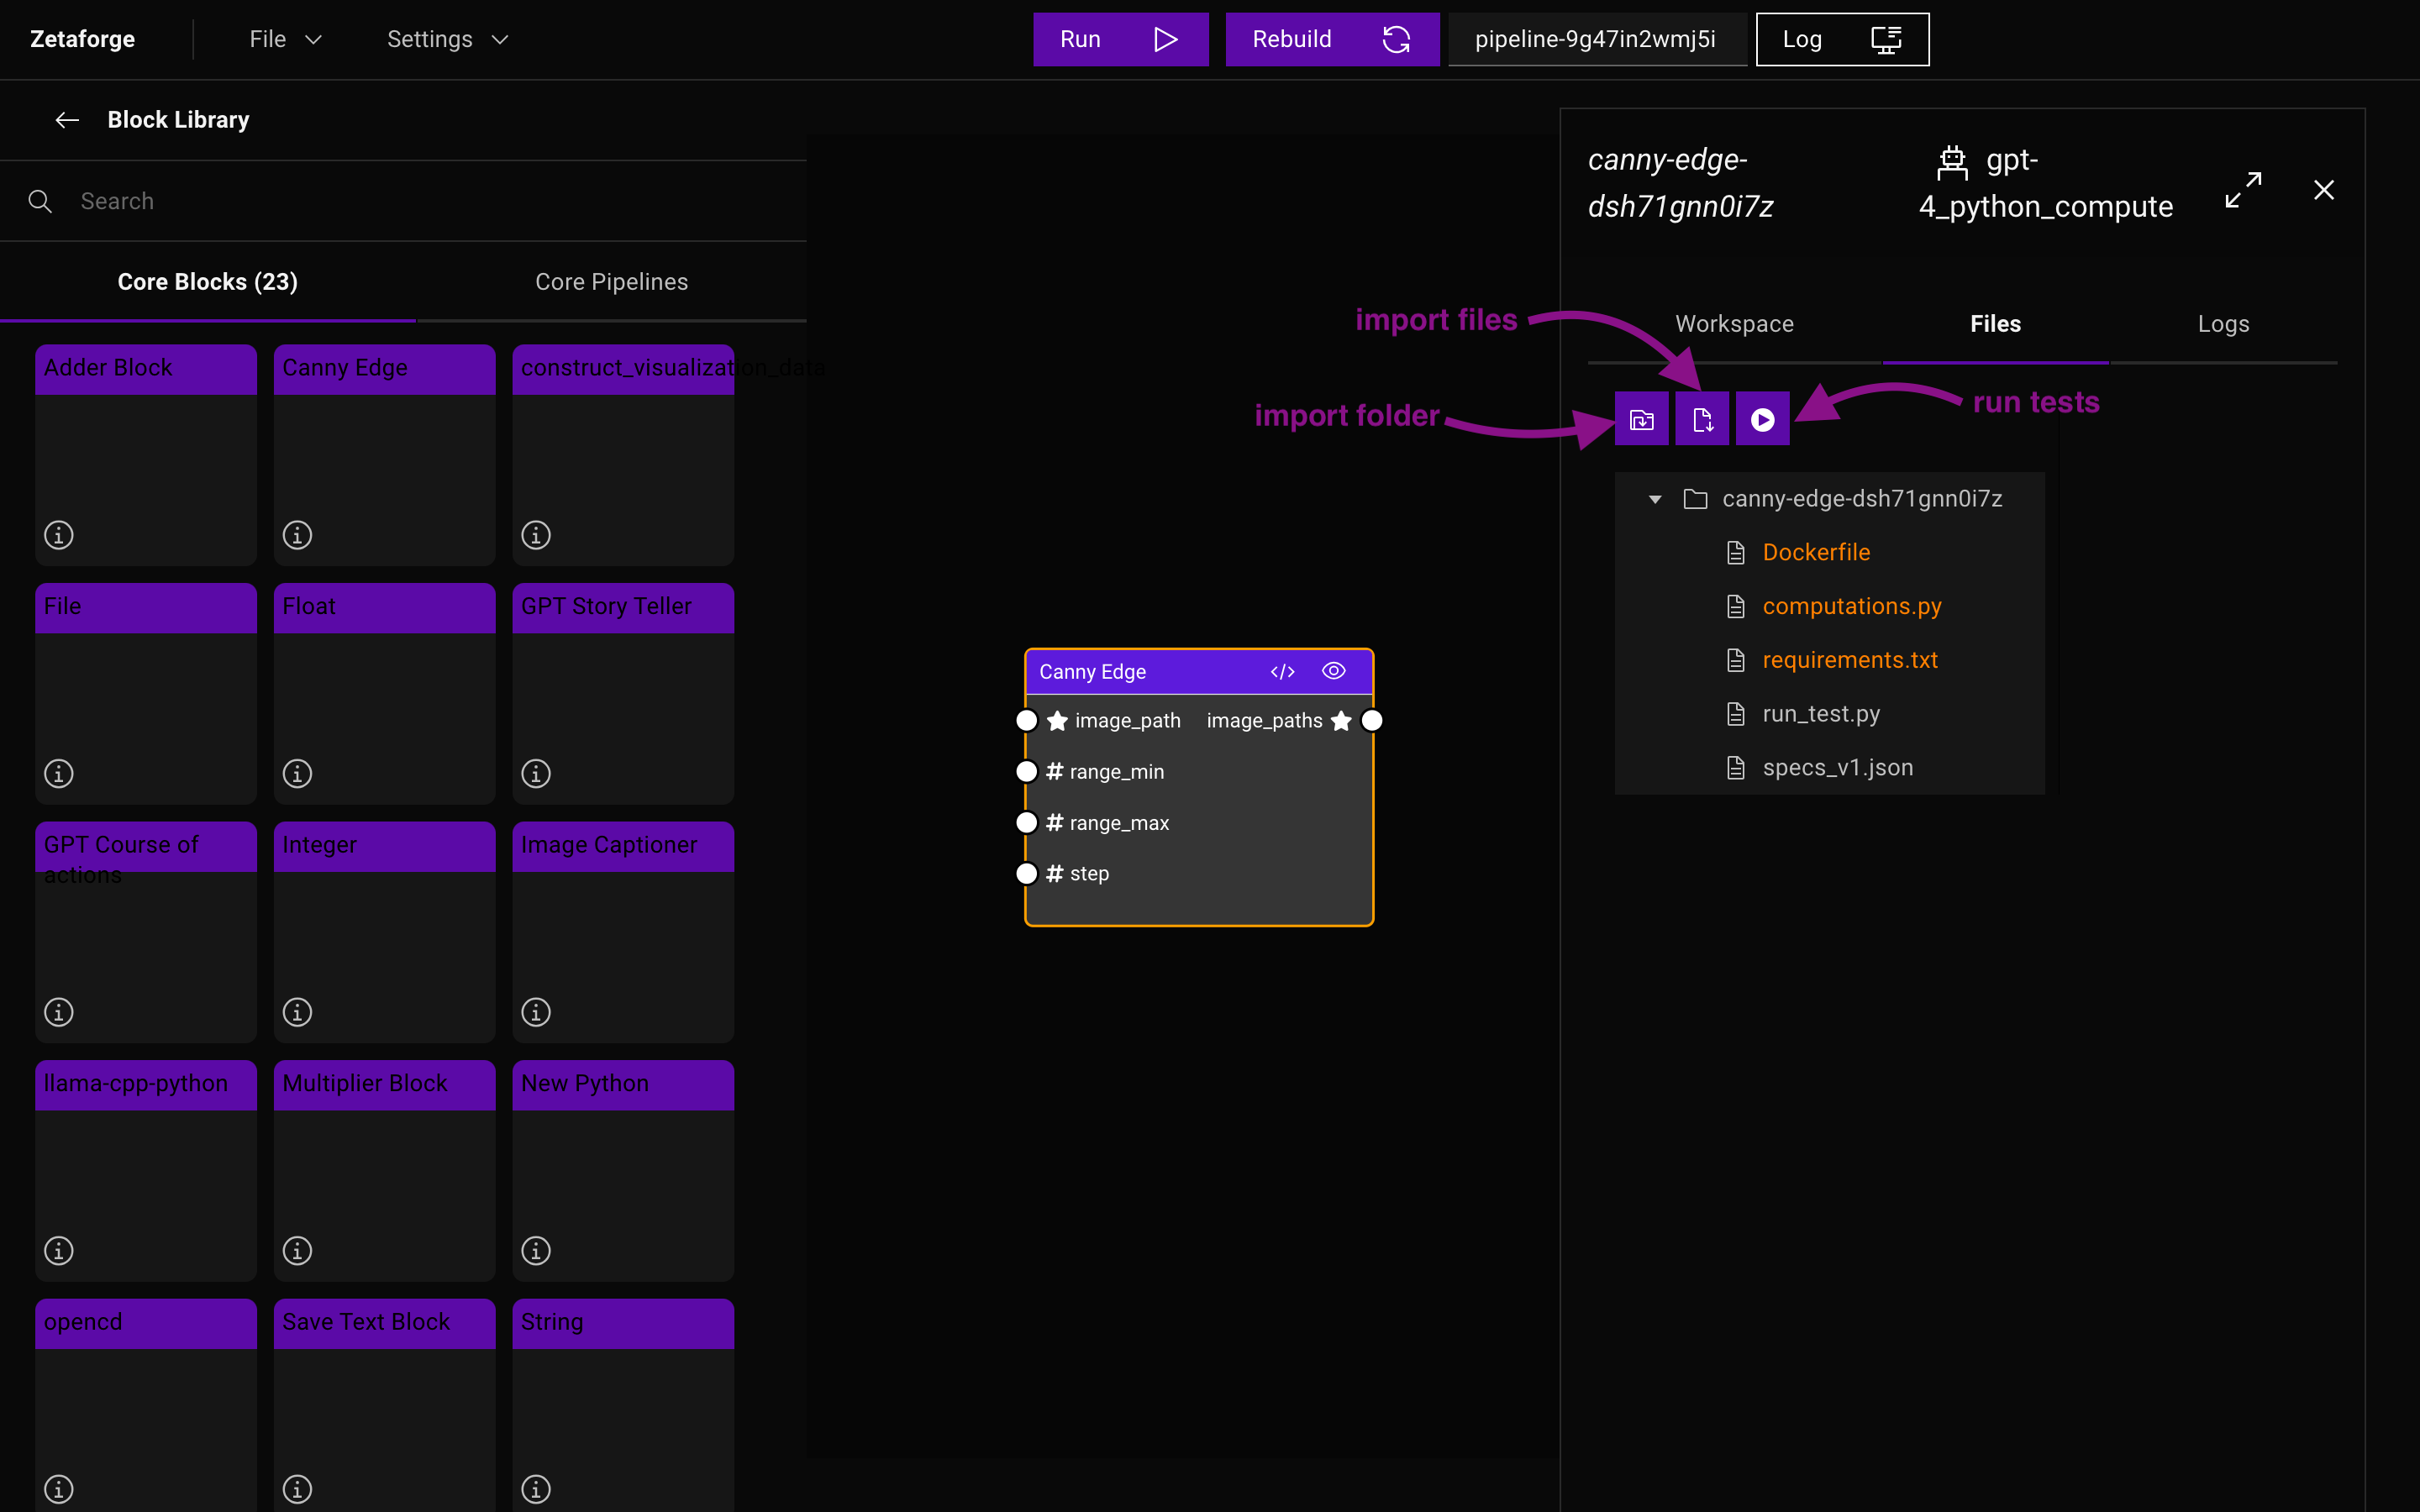
As explained in detail in the Block Components section, each Block consists of one or several
files, depending on its type. You can see these components under the Files tab. You can directly modify these files
and save your changes through the UI. Also, to import a folder or multiple files to your workspace, you can click on
Import Folder
 or Import Files
 icons.
You can call the test function in your computations.py file in a separate container to test your code before building
the Pipeline. To test your code, click on the Run Test
 button.
Logs
Under the Logs tab, you can see the logs that are generated when Run Test executes. These are the Docker build logs and
the outputs generated by the test function in computations.py.
Note: These logs are different from the execution logs explained in the execution logs section.
Enabling AI-assisted Coding (Optional)
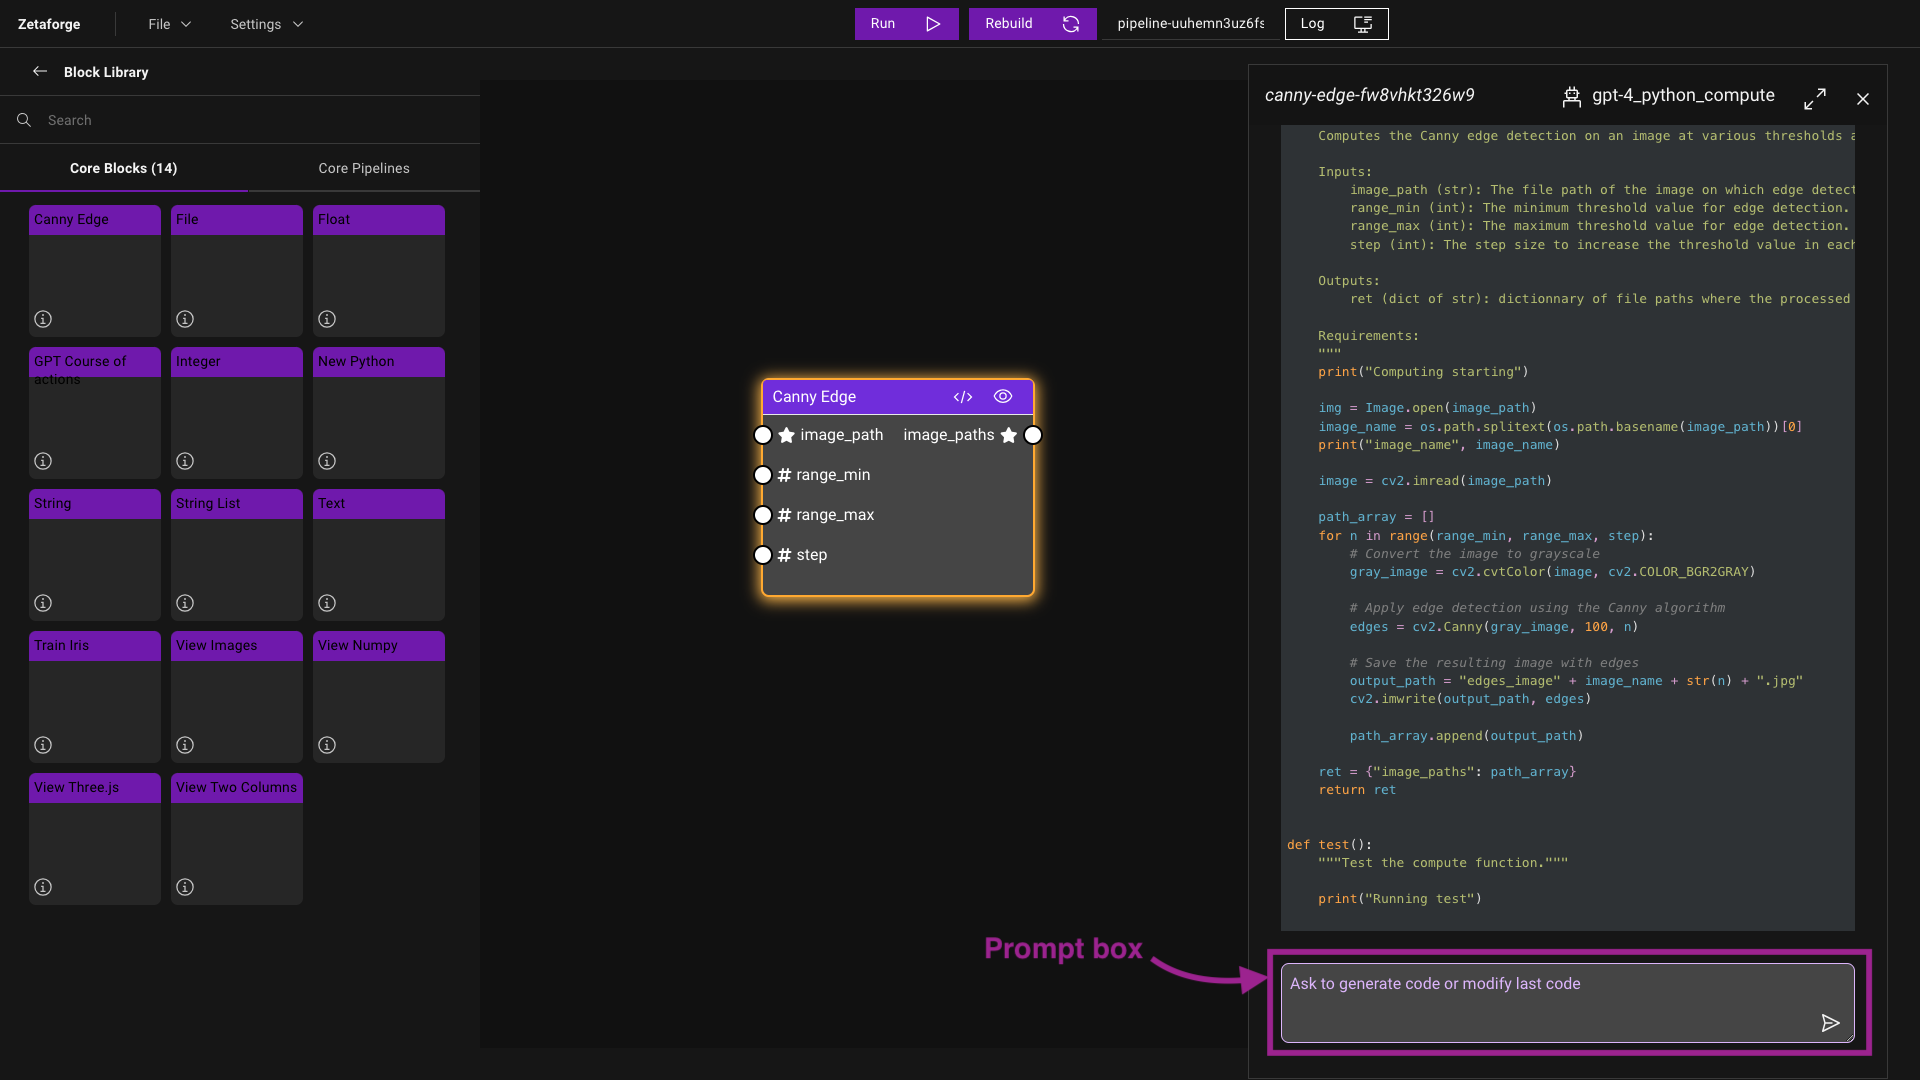
If you want to use an AI agent's help to write or modify your code, after setting your API keys , scroll down to the prompt box and type in the code logic or the modification you want to make. Press enter and wait to see the magic happen! If you like the generated code, compile the Block to use the new code next time you are running the Pipeline.
Handling Pipelines
Run Pipelines
To run a Pipeline, you need to have at least one compute Block
(What is a compute Block?). Ensure you've established the correct links between the Blocks before running a
Pipeline. When everything is all set, click on the Run button on the top of the main window to
execute your Pipeline.
Build Pipelines
If you made some changes to some of the Blocks and need to rebuild your Pipeline, you can click on the Rebuild button
next to the Run button and all the Docker images will be built from scratch.
Logs
When you run a Pipeline, a window pops up that contains the log that are being generated. You can read through the logs
for debugging purposes. Closing the logs window keeps your code running in the background. If you closed the logs but
need to head over to the log window again, simply click on the Logs button, and you should be able to see the window
again.
Set Your API Keys
The prompt-based code generation feature need an active API key. If you wish to use the AI-assisted coding,
navigate to Settings -> API Keys and enter your OpenAI API key.
Note: The API key will not be accessible from the Blocks. If you need to use your API key inside a Block, you should pass it using a Parameter Block.
Other Settings
If you need to debug something, you can go to View -> Toggle Developer Tools from the application top bar.
You can switch themes between Dark Mode and Light Mode by clicking on Settings -> Theme. Try it now to see which one
you are more comfortable with!